Date: Wed, 15 Jul 2026 17:31:55 +0000
Dear Colleagues,
I have a few questions regarding spectrum plotting in TopSpin and would
appreciate your advice.
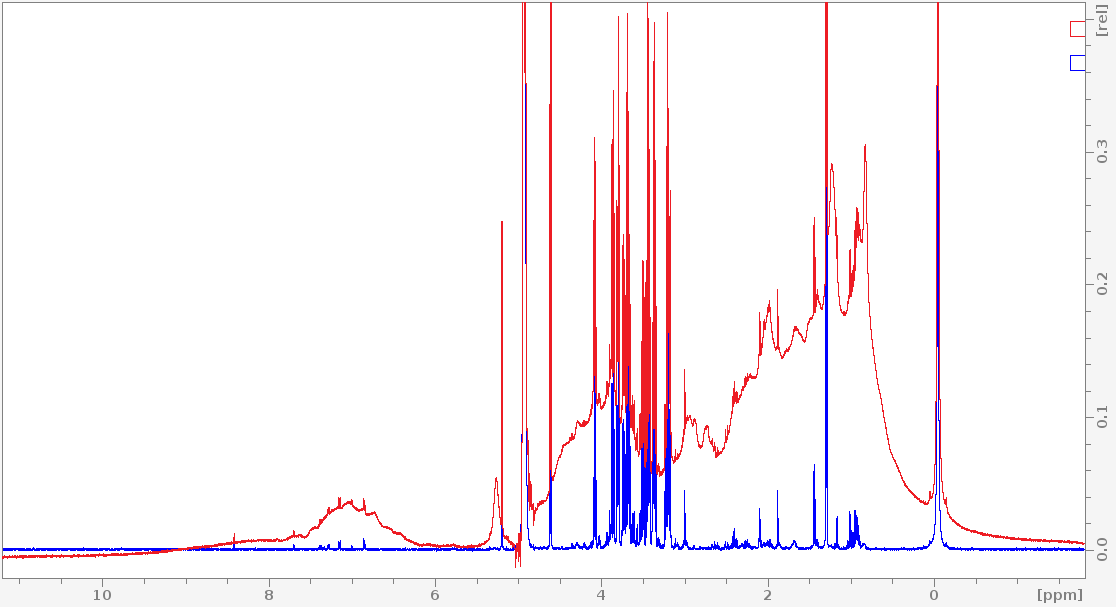
When I export a 1D spectrum from TopSpin, the relative intensity scale is always
printed on the right side of the spectrum. In contrast, the Plot function does
not include the intensity scale. However, I have not been able to generate stacked
color spectra using the Plot function.
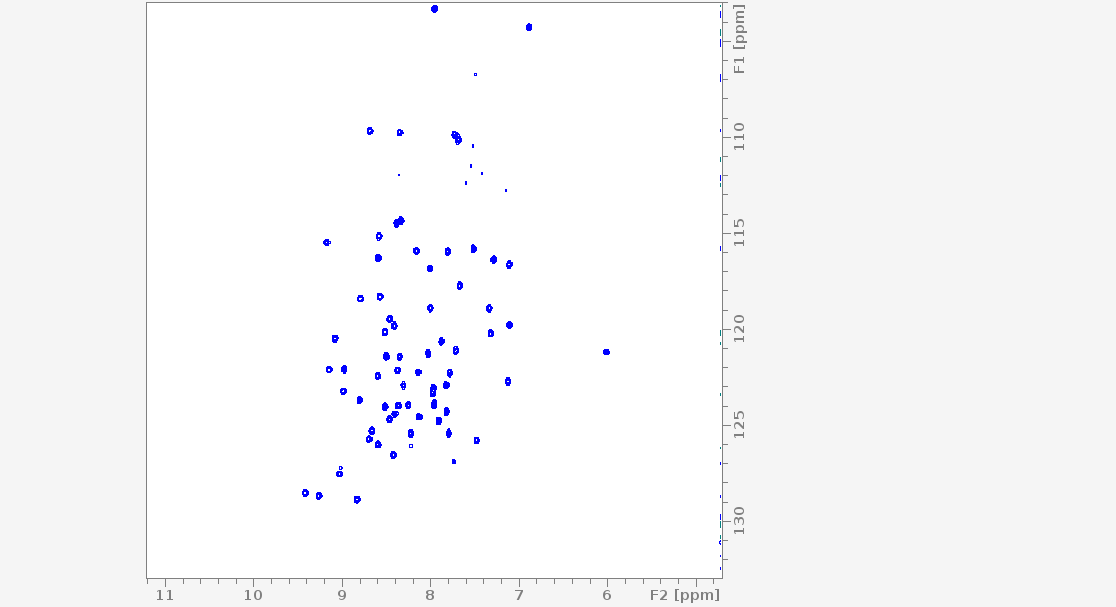
For 2D spectra, I often see published figures in which the "ppm" label is printed
outside the ppm scale, as shown in the example below. However, both the standard
TopSpin export and the Plot function place the "ppm" label on the same line as
the ppm scale. Is there a way to export or plot 2D spectra in the format shown below?
Thank you in advance for your help.
Best regards,
Weixing
________________________________
Email Disclaimer: http://www.stjude.org/emaildisclaimer
Consultation Disclaimer: http://www.stjude.org/consultationdisclaimer
-=-=-=-=-=-=-=-=-=-=-=-
Groups.io Links: You receive all messages sent to this group.
View/Reply Online (#3568): https://urldefense.com/v3/__https://ammrl.groups=
.io/g/main/message/3568__;!!PvDODwlR4mBZyAb0!W_9-rMGFDC4r-yKXq841RqI7vXYrx-=
1d8A4x03iduFkxXFErDlrqv0t6ha1LoXt47js3So1BQ2wQXO_v-QaS1TwWrz5W$
Mute This Topic: https://urldefense.com/v3/__https://groups.io/mt/120286117=
/7559972__;!!PvDODwlR4mBZyAb0!W_9-rMGFDC4r-yKXq841RqI7vXYrx-1d8A4x03iduFkxX=
FErDlrqv0t6ha1LoXt47js3So1BQ2wQXO_v-QaS1Tn--j3j$
Group Owner: main+owner_at_ammrl.groups.io
-=-=-=-=-=-=-=-=-=-=-=-

(image/png attachment: image001.png)
(image/png attachment: 2d_spectrum.png)
(image/png attachment: 1d_spectrum.png)